Want to bypass Turnitin in 2026? Grab the free prompt pack.
Get the exact text-humanization prompts I use to drop an AI score by hand — copy, paste, submit. Free, straight to your inbox.
Send me the free prompts →Key Takeaways
- → Zero primary surveys measure AI humanizer adoption. The widely-quoted “38% of students use humanizers” figure does not appear in any study we could locate. (Detection Drama audit)
- → The real 38% comes from HEPI Report 199 and refers to students who say their institution provides them with AI tools — a completely different question. (HEPI, 2026)
- → 95% of UK undergraduates report using AI in at least one way, and 94% use it to help with assessed work. (HEPI, 2026)
- → 12% directly include AI-generated text in assessed work, up from 8% in 2025 and 3% in 2024. This is not the same as submitting an unedited AI essay. (HEPI, 2026)
- → Only ~5% of US students say they always or often use AI to generate a full assignment. (Packback, 2026)
- → ~75% are at least moderately worried about being wrongly accused — but no survey has measured how many actually have been. (Packback, 2026)
- → Turnitin’s stated document-level false positive rate is under 1%, not the 4% figure routinely attributed to it. The 4% is a sentence-level rate. (Turnitin, 2023)
- → US search interest in “AI humanizer” is down roughly 75% from its December 2025 peak — the opposite of the “exponential growth” claim. (Google Trends, July 2026)
Search for AI humanizer usage statistics and you will find the same three numbers repeated across dozens of pages: 38% of students use humanizer tools, 14% have been falsely accused of AI use, and 12% submit essentially unmodified AI output. They appear in vendor blog posts, in roundups, in LinkedIn carousels, and increasingly in the answers that AI assistants give when asked about the humanizer market.
We tried to trace each of them to a primary source — a named survey, with a sample size, a fieldwork date, and a methodology. Not one of them survived. Two turned out to be real numbers from real studies that had been quietly relabelled to mean something else. One appears to have no origin at all. Along the way, the most-cited false-positive statistic in the entire AI detection debate also fell apart, and Google Trends data flatly contradicted the industry’s favourite growth narrative.
What follows is everything about humanizer usage that is verifiable as of July 2026, and a clear accounting of what is not.
Want to bypass Turnitin in 2026? Grab the free prompt pack.
Get the exact text-humanization prompts I use to drop an AI score by hand — copy, paste, submit. Free, straight to your inbox.
Send me the free prompts →1 How many students actually use AI humanizers?
Nobody knows. As of July 2026 there is no published survey, from any institution, vendor, or research group, that asks students whether they use AI humanizer or detection-bypass tools and reports the result with a stated sample size and methodology.
This is a strange gap. Humanizers are a commercial category with real revenue, real affiliate programs, and real search demand. Detection is one of the most heavily surveyed topics in education technology. Yet the specific behaviour that connects the two — running text through a rewriter to defeat a detector — has never been measured directly in a study we can find.
What exists instead is a small number of legitimate surveys about AI use generally, whose findings have been progressively reshaped, as they get quoted and requoted, into claims about humanizers specifically. The table below shows each circulating claim next to what we found when we went looking for its source.
| Circulating claim | Verdict | What the source actually says |
|---|---|---|
| “38% of students use AI humanizer tools” | NO SOURCE | No study located. The only 38% in the underlying survey refers to students whose institution provides them with AI tools. |
| “14% of students have been falsely accused” | NO SOURCE | No study measures incidence. Packback measured concern: ~75% are at least moderately worried about it. |
| “12% submit essentially unmodified AI output” | MISLABELLED | HEPI’s 12% is students who “directly include AI-generated text in assessed work” — which counts a single sentence. |
| “Turnitin admits a 4% false positive rate” | CONFLATED | 4% is Turnitin’s sentence-level rate. Its stated document-level rate is under 1%. |
| “Humanizer search volume is growing exponentially” | CONTRADICTED | US Google Trends shows a ~75% decline from the December 2025 peak. |
| “95% of undergraduates use AI in some form” | VERIFIED | HEPI Report 199, n=1,054 UK full-time undergraduates, fieldwork December 2025. |
The pattern is consistent. Every claim that flatters the humanizer category — that adoption is huge, that most users are innocent victims of false accusation, that demand is exploding — is the one without a source. Every claim that survives scrutiny is more modest and more boring. That asymmetry is itself the finding, and it is worth holding in mind whenever you read a statistic about how often AI detectors get it wrong.
It is worth being precise about what a real measurement would need to look like, because the absence of one is not inevitable. A usable humanizer adoption study would need a defined population and sampling frame, a question that names the behaviour without euphemism, and some mitigation for the obvious social-desirability problem — students have an incentive to under-report a practice most institutions treat as misconduct. Self-report will always undercount here. That difficulty explains why the number does not exist; it does not license anyone to invent one. Until somebody funds the study, the honest answer to “how many students use humanizers” is that the question has never been asked properly, and any page that answers it with a specific percentage is telling you something about its own sourcing standards rather than about students.
2 What the real surveys measure
Two credible surveys anchor everything worth knowing here: HEPI Report 199 (1,054 UK undergraduates, fieldwork December 2025) and a Packback survey of roughly 700 US college students conducted in January 2026. Neither asks about humanizers.
The Higher Education Policy Institute’s Student Generative AI Survey 2026, conducted by Savanta, is the most methodologically transparent data we have. It is a weighted sample, the underlying data tables are published, and it runs annually so the year-on-year movement is meaningful rather than anecdotal.
| Metric | Value | Source |
|---|---|---|
| Students using AI in at least one way | 95% | HEPI Report 199 (2026) |
| Using genAI to help with assessed work | 94% | HEPI Report 199 (2026) |
| Directly including AI-generated text in assessed work | 12% | HEPI Report 199 (2026) |
| Same figure, one year earlier | 8% | HEPI (2025) |
| Same figure, two years earlier | 3% | HEPI (2024) |
| Say assessment has changed significantly due to AI | 65% | HEPI Report 199 (2026) |
| Say their institution provides AI tools | 38% | HEPI Report 199 (2026) |
| Always or often use AI to generate a full assignment | ~5% | Packback (2026) |
| Often use AI to support coursework | ~25% | Packback (2026) |
| At least moderately concerned about false accusation | ~75% | Packback (2026) |
Packback’s survey adds the behavioural texture HEPI lacks. Among the roughly 5% who admit to generating whole assignments, the stated reasons were time constraints (46%), not knowing enough about the topic (43%), and lack of interest (42%). Packback’s chief executive noted that the students being academically dishonest with AI today are broadly the same students who were academically dishonest a decade ago — the rate is comparable to pre-AI contract cheating.
There is one more Packback finding that matters, because it is the closest thing to evidence for the “defensive humanizer use” theory: about a quarter of students said they often use AI to support coursework, while roughly three times as many believed their peers were doing so. Students systematically overestimate how much everyone else is cheating. That misperception is a plausible driver of anxiety, and anxiety is what sells rewriting tools — but a plausible mechanism is not a measurement, and it should not be reported as one. The distinction matters most for students writing in a second language, who face the highest false-positive risk and therefore the strongest incentive to reach for a tool.
3 Where the “38%” actually came from
HEPI Report 199 contains the sentence: “only 36% feel encouraged by their institution to [use AI], and only 38% say they are provided with AI tools.” Somewhere downstream, “provided with AI tools” became “use humanizer tools.”
This is worth sitting with. The 38% is a real number, from a real weighted survey of 1,054 students. It measures institutional provision — whether a university gives its students access to AI software. It says nothing whatsoever about humanizers, about detection evasion, or about student behaviour of any kind.

The same decay happened to HEPI’s 12%. In the report it describes students “directly including AI-generated text in assessed work.” A student who pastes one AI-drafted sentence into a 3,000-word essay is counted. By the time the figure reaches a vendor blog it has become “12% submit essentially unmodified AI output” — a claim about wholesale outsourcing that HEPI never made and that its own data contradicts, since Packback puts full-assignment generation at around 5%.
Why does this keep happening in this particular niche? Because the incentives point one way. The pages that rank for humanizer statistics are, overwhelmingly, published by companies that sell humanizers. A number showing that 38% of students already use these tools does commercial work: it normalises the category and reassures the buyer. A number showing that most humanizer users are innocent students defending themselves against faulty detectors does even more. Neither number has to be true to be useful, and once it exists in one blog post it can be cited by the next without anyone ever opening the underlying report. This is the same dynamic that produces inflated claims in vendor-published bypass rate testing, where the party running the benchmark also sells the product being benchmarked.
4 The false-positive numbers are mislabelled too
Turnitin has publicly stated a document-level false positive rate of under 1% — specifically, for documents containing 20% or more AI writing. The 4% figure attributed to the company is its sentence-level rate: the chance that any individual highlighted sentence is actually human-written.
These are not interchangeable, and the difference is not academic. A widely-shared calculation takes the 4% figure, multiplies it across the millions of US students whose work passes through Turnitin each year, and arrives at a five-figure count of students wrongly accused. The arithmetic is internally consistent. The input is the wrong statistic. Applying a per-sentence error rate to whole students overstates the document-level result by several multiples — a long document contains many sentences, and the chance that at least one is flagged in error is not the chance that the document is condemned. Turnitin’s own detection documentation is considerably more careful than either the 4% extrapolation or the company’s marketing: it states that the model can misidentify text and that its output should not serve as the sole basis for an academic misconduct decision.
| False positive metric | Value | Source |
|---|---|---|
| Turnitin, document level (documents with ≥20% AI writing) | <1% | Turnitin CPO, 2023 |
| Turnitin, sentence level | ~4% | Turnitin sentence-level disclosure, 2023 |
| GPTZero, human-written essays | ~16% | 2025 study, reported by Nature (2026) |
| Detectors on non-native English essays | 61.3% | Stanford, Liang et al. (2023) |
Note the year on that last one. It is a 2023 study, and it is still the most-cited evidence of demographic bias in AI detection three years later. That is not a criticism of the study; it is an indictment of how little independent replication the field has attracted since. When the strongest available evidence for the field’s most serious equity problem is three years old, both the detection vendors and their critics are arguing from a thin base. Students who find themselves on the wrong end of a detector score should understand this landscape before assembling a defence of their own work, and the growing number of institutions that have switched detection off entirely have generally cited exactly this evidentiary thinness as their reason.
5 Search demand is falling, not exploding
US search interest in “AI humanizer” peaked in the week of 7 December 2025 at an index value of 100. By the week of 5 July 2026 it had fallen to 25 — a decline of roughly 75%.
The claim that humanizer search volume is rising exponentially appears in nearly every market overview of the category. It is checkable in about ninety seconds, and it is wrong. What the Trends series actually shows is a category with violent academic-calendar seasonality: interest climbs through the autumn term, spikes into December finals, collapses to almost nothing over the winter break, rebuilds through the spring term, and then falls away again across the northern summer.
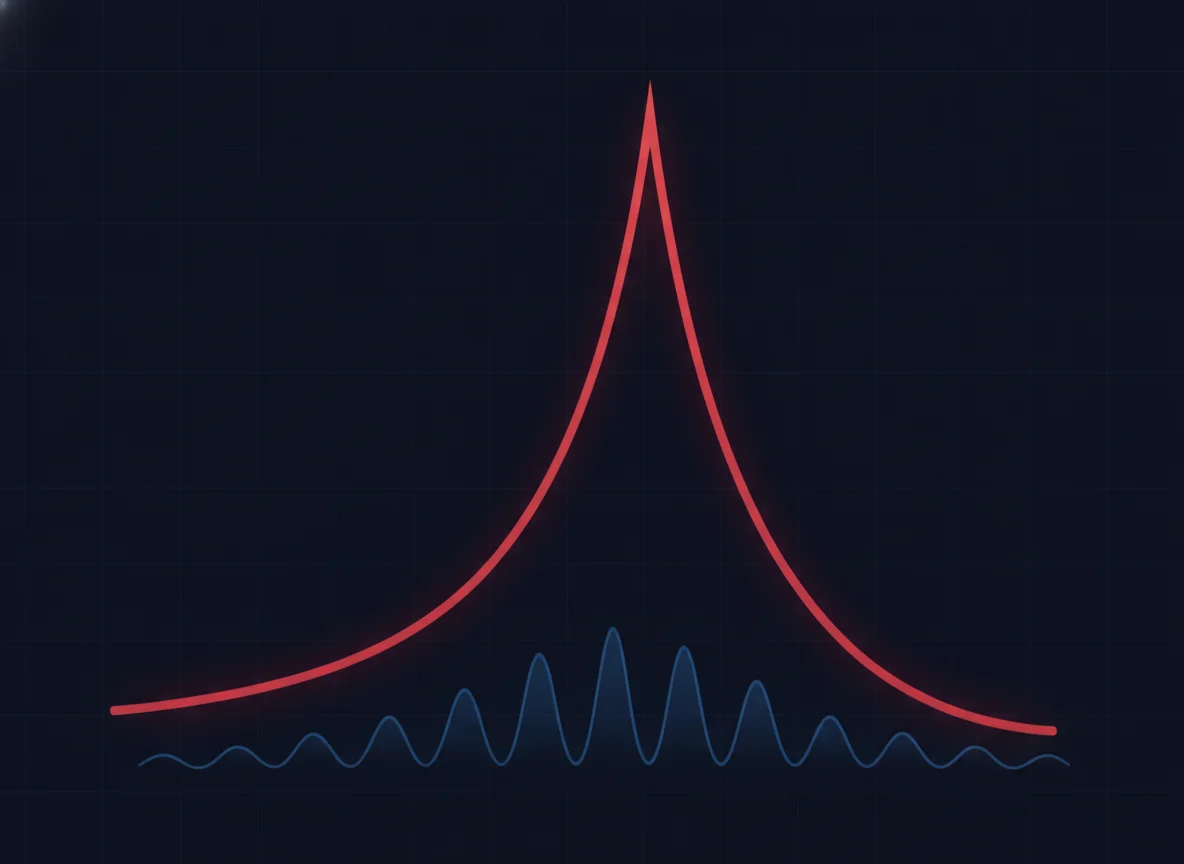
Two cautions on reading this. First, Trends measures relative search interest, not absolute volume or revenue — a category can shed search interest while growing commercially, particularly if it shifts from consumer discovery to embedded and enterprise use. Second, July is a seasonal trough by construction, so a peak-to-trough reading overstates the decline. The honest comparison is like-for-like: the week of 5–11 July 2026 scores 25, against 22 for the equivalent week of 6–12 July 2025. Year-on-year, interest is broadly flat. Flat is a perfectly respectable finding. It is simply not the one the category’s own marketing reports.
6 Check a statistic yourself
Pick any commonly-cited figure from this niche and see what our audit found when we traced it. Every verdict below links back to the primary document where one exists.
Methodology
Every statistic circulating about AI humanizer adoption was collected from the pages currently ranking for humanizer-statistics queries. Each was then traced backwards through its citation chain until it reached either a named study with a stated sample size and methodology, or a dead end. A figure is marked VERIFIED only where we reached the original report and confirmed the number and its wording. Where a real study exists but the claim has drifted from what the study measured, the figure is marked MISLABELLED or CONFLATED, and the original wording is quoted. Where no origin could be found, it is marked NO SOURCE.
Google Trends data was retrieved directly from the Trends API on 10 July 2026 for the query “ai humanizer”, geography United States, over a rolling 60-month window. Index values are relative to the series peak and do not represent absolute search volume.
- Sources consulted: 14 across primary surveys, vendor documentation, news reporting, and search data
- Sources cited: 7
- Data range: 2023–2026, with all headline figures drawn from 2026 sources where available
- Last verified: 10 July 2026
- Update schedule: Quarterly, and immediately upon publication of any primary survey measuring humanizer adoption
- Known limitation: The HEPI sample is UK-only; the Packback sample is US-only and drawn from students already enrolled in Packback-supported courses, which may not be nationally representative
Frequently Asked Questions
How many students use AI humanizer tools?
No primary survey measures this. The commonly cited 38% traces back to HEPI Report 199, where 38% refers to students who say their institution provides them with AI tools — an unrelated question. As of July 2026 no published study with a stated sample size and methodology measures humanizer adoption specifically.
What percentage of students submit AI-generated text?
HEPI Report 199 found 12% of UK undergraduates directly include AI-generated text in assessed work, up from 8% in 2025 and 3% in 2024. A separate Packback survey of about 700 US students found roughly 5% always or often use AI to generate a full assignment. These measure different behaviours and are frequently conflated.
Is Turnitin’s false positive rate really 4%?
Not at the document level. Turnitin’s Chief Product Officer has stated a document-level false positive rate of under 1%. The 4% figure is the sentence-level rate — the chance any individual highlighted sentence is human-written. Extrapolating the sentence-level rate across whole student populations inflates the result substantially, which is how the widely-shared “88,000 wrongly accused students” number was produced.
Are AI humanizers becoming more popular?
US search interest for “AI humanizer” peaked in the week of 7 December 2025 and had fallen roughly 75% by early July 2026, according to Google Trends. Interest follows a strong academic-calendar cycle. Measured year-on-year rather than peak-to-trough, the category is close to flat.
How many students have actually been falsely accused of using AI?
No survey has measured incidence. Packback measured concern: roughly three-quarters of US college students are at least moderately worried about being wrongly accused, and more than 40% call it a major concern. The circulating “14% have been falsely accused” figure has no traceable primary source. If you are facing an accusation, what matters is the evidence you can assemble in the first 24 hours, not the base rate.
Do AI detectors flag non-native English speakers more often?
Yes. A 2023 Stanford study found detectors incorrectly labelled more than half of essays by non-native English speakers as AI-generated, with an average false-positive rate of 61.3%. No superseding study of comparable scope had been published as of July 2026, though detector accuracy varies considerably by language.
Which humanizer statistics are safe to cite?
The HEPI figures (95% AI use, 94% for assessed work, 12% pasting AI text, 38% institutional provision) and the Packback figures (~5% full-assignment generation, ~75% concern about false accusation) are traceable to published surveys with stated methodologies. Anything describing humanizer adoption specifically is currently unsupported, including in most market sizing for the wider detection industry.
Sources & References
- Higher Education Policy Institute. “Student Generative Artificial Intelligence Survey 2026” (Report 199, Stephenson & Armstrong; fieldwork by Savanta, December 2025). hepi.ac.uk. Accessed 10 July 2026.
- Inside Higher Ed. “Students Embrace AI but Fear False Accusations” (reporting the Packback survey, January 2026). insidehighered.com. Accessed 10 July 2026.
- Turnitin. “Understanding false positives within our AI writing detection capabilities” (Annie Chechitelli, Chief Product Officer) — source for the document-level rate of under 1%. turnitin.com. Accessed 10 July 2026.
- Turnitin. “Understanding the false positive rate for sentences of our AI writing detection capability” — source for the ~4% sentence-level rate. These are two separate disclosures and are routinely conflated. turnitin.com. Accessed 10 July 2026.
- Nature. Reporting on AI detector reliability and false-positive research, July 2026. nature.com. Accessed 10 July 2026.
- The AI Insider. “AI Detectors Are Flagging Human Writing as Machine-Generated” (7 July 2026). theaiinsider.tech. Accessed 10 July 2026.
- Google Trends. Search interest for “ai humanizer”, United States, 60-month window. trends.google.com. Retrieved 10 July 2026.
