
How Many Students Actually Get Caught Using AI? Every Published Number (2026)
The honest answer to “how many students get caught using AI” is two numbers that don’t agree with each other. One is the count of proven cases universities record — and it’s rising fast. The other is the share of AI work that actually gets flagged — and it’s small. This is a report on both numbers, pulled only from Freedom of Information data, university disclosures, and peer-reviewed tests, with every figure sourced.
The only tool that bypassed Pangram and Turnitin in 2026.
Most humanizers clear one detector and get caught by the other. StealthWriter is the one that gets past both — run Ghost 5.2 Pro at level 7–8, section by section, and re-check before you submit.
Try StealthWriter →Key Takeaways
- → UK universities recorded roughly 7,000 proven AI-misconduct cases in 2023-24 — 5.1 per 1,000 students, up from 1.6 the year before (Guardian FOI)
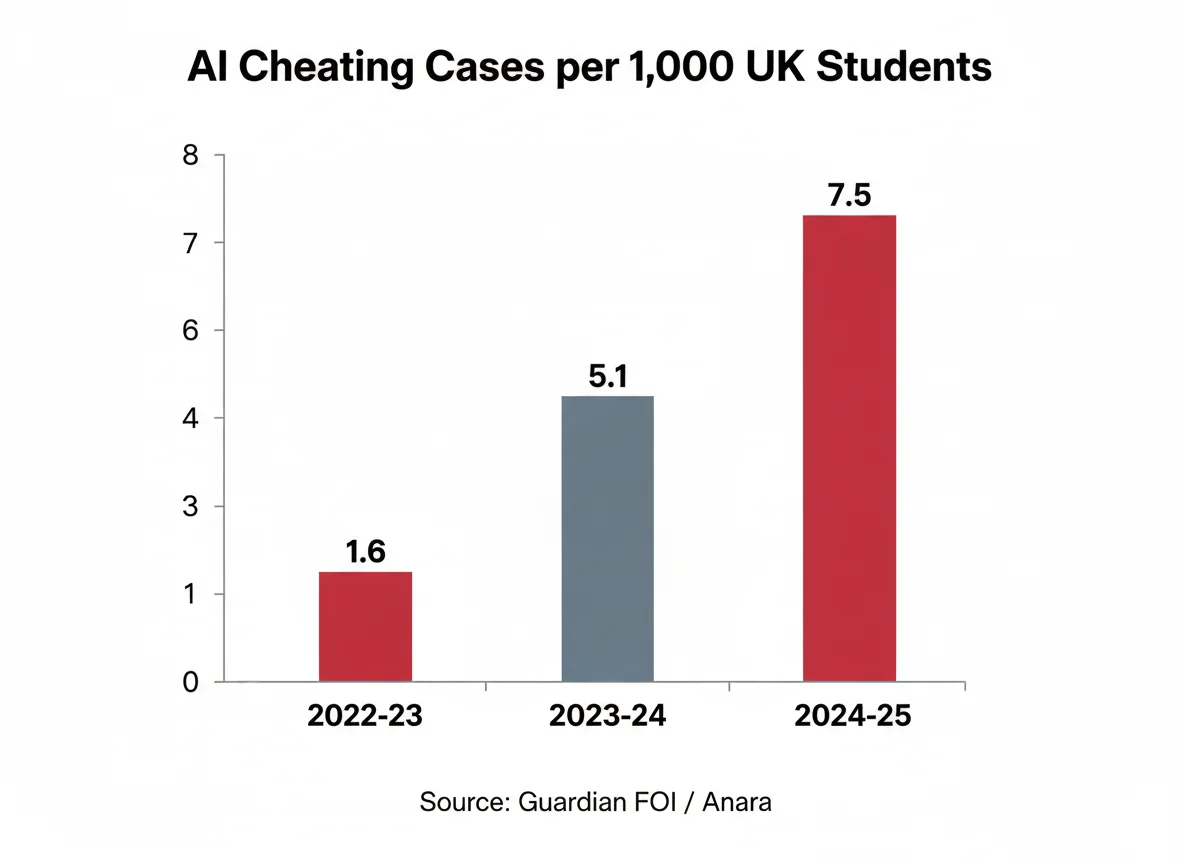
- → The UK rate rose again to 7.5 per 1,000 in 2024-25 — a near-400% climb in two years (Anara, 2025)
- → Scottish universities saw a +700% jump: 131 cases to 1,051 in a single year (FOI)
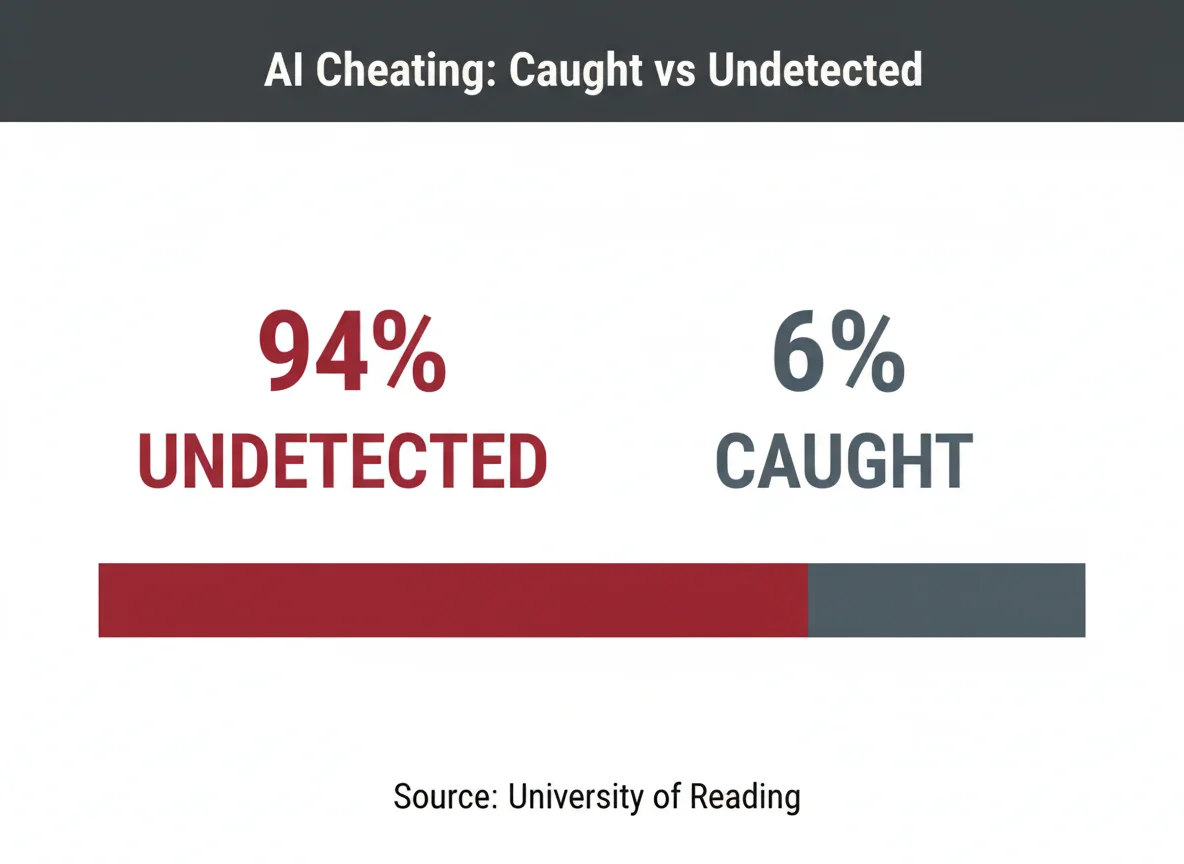
- → Yet 94% of AI submissions went undetected in a controlled Reading test (University of Reading, 2024)
- → Turnitin found AI writing in 11% of 200M+ scanned assignments; 3% were mostly AI (Turnitin)
- → AI detectors flag 61.2% of non-native English essays as AI vs 5.1% for native speakers — so some “caught” students never used AI (Stanford)
1 How Many Students Are Actually Caught?
The best hard data comes from UK Freedom of Information requests: about 7,000 proven AI-misconduct cases across 131 universities in 2023-24, a rate of 5.1 per 1,000 students. That is triple the previous year’s 1.6 per 1,000 — and it counts only students who were formally caught and sanctioned.
| Metric | Value | Source |
|---|---|---|
| Proven UK AI cases, 2023-24 (131 universities) | ~7,000 | Guardian FOI |
| UK proven-case rate, 2023-24 | 5.1 / 1,000 | Guardian FOI |
| UK proven-case rate, 2022-23 | 1.6 / 1,000 | Guardian FOI |
| UK proven-case rate, 2024-25 | 7.5 / 1,000 | Anara, 2025 |
| Scottish cases, 2022/23 → 2023/24 | 131 → 1,051 | FOI (+700%) |
| Abertay University cases (upheld) | 351 (342) | FOI |
| Sources: Guardian FOI investigation of 131 UK universities; Anara 2025 higher-education report; Scottish FOI disclosures. | ||
These are enforcement numbers, not behaviour numbers. A case only appears here after a detector flag or a report, an investigation, and an upheld finding. The Abertay figure is telling: of 351 cases raised, 342 were upheld — a 97% upheld rate that shows how rarely, once opened, a case is dropped. If you have been flagged, the practical response is the same one integrity offices respect: assembling an authorship packet before the meeting rather than after.
2 The Detection Gap: Caught vs. Undetected vs. Admitted
The number caught is dwarfed by the number who use AI. In a University of Reading experiment, 94% of AI-generated submissions were never flagged. Surveys suggest real usage runs far ahead of both the caught rate and what students will admit.
This gap is the whole story. Self-reported use undercounts true use by an estimated 2.5x-3x, so a headline “18% of undergrads admit it” likely maps to real usage in the high 30s or low 40s of percent. Against that, a proven-case rate of 5.1 per 1,000 (0.51%) means the odds of any single AI user being formally caught are low — but not zero, and rising each year. The detectors doing the flagging also disagree with each other constantly, which is documented in the detector-disagreement data, so whether you are caught depends heavily on which tool your institution runs.
3 The Three-Year Surge in Proven Cases
Even though most AI use is missed, the raw count of caught students is climbing steeply as institutions adopt detectors and train staff to spot AI writing. The UK proven-case rate has nearly quadrupled in two years.
The climb is driven by supply and enforcement, not a sudden collapse in student ethics: more institutions bought detection tools, more markers were trained to notice AI cadence, and reporting pipelines matured. That is the same trend behind rising AI cheating consequences and the broader AI detection industry numbers. It also explains a paradox: schools catch more students each year while the share of AI work they miss stays enormous.
4 US Campus Case Counts
The US has no national FOI equivalent, but individual campuses that release integrity data show the same trajectory — AI cases doubling or more year over year, even as some older forms of misconduct fall.
| Institution | AI Cases | Source |
|---|---|---|
| University of Maryland (2023-24 → 2024-25) | 135 → 215 | The Diamondback |
| West Virginia University (22-23 → 24-25) | 11 → 242 | The Daily Athenaeum |
| Columbia University AI cases (2025) | 79 of 227 | Columbia disclosures |
| Turnitin: assignments with AI writing | 11% | Turnitin (200M+ scanned) |
| Turnitin: assignments mostly AI | 3% | Turnitin |
| Sources: The Diamondback (UMD); The Daily Athenaeum (WVU); Columbia integrity disclosures; Turnitin AI-writing detection data. | ||
The University of Maryland’s 59% single-year rise and WVU’s jump from 11 to 242 cases in two years mirror the UK curve. And Turnitin’s own scan of over 200 million assignments — 11% with some AI, 3% mostly AI — is a useful sanity check on how widespread the underlying behaviour is compared with how few cases actually reach a disciplinary panel. Many flagged students had legitimate drafts, which is exactly why version history as evidence has become the front line of these disputes.
5 Why the “Caught” Number Is an Undercount — and Overcount at Once
The caught figure is unreliable in both directions. It misses the vast majority of real AI use, while sweeping up innocent students — especially non-native English writers — through detector false positives.
On the undercount side, the 94% miss rate from Reading and Turnitin’s finding that only 3% of assignments read as mostly-AI both point the same way: detectors catch a fraction of real use. On the overcount side, the documented ESL bias in detectors and high false-positive rates mean a meaningful share of proven cases may rest on shaky detector output — which is why a growing list of universities have banned AI detectors outright and why detector scores rarely count as standalone proof. If you are ever flagged, the first move is knowing what to do in the first 24 hours.
Methodology
This report compiles only figures that trace to a Freedom of Information disclosure, an institution’s own integrity data, a peer-reviewed study, or a vendor’s published detection data. Where a rate and a raw count describe the same population, the more recent source is used in the text. Percentages are reproduced as reported; the “true AI use” band is an estimate derived from survey self-reports adjusted for known undercounting, and is labelled as such.
- Sources consulted: 9 across FOI investigations, university newspapers, peer-reviewed studies, and detection vendors
- Data range: 2022-23 to 2024-25 academic years
- Last verified: July 25, 2026
- Update schedule: Reviewed each academic term as new FOI data is released
- Limitations: “Caught” counts reflect only proven, upheld cases; detector false positives mean some are contested. US data is campus-by-campus, not national.
Frequently Asked Questions
How many students actually get caught using AI?
UK Freedom of Information data recorded roughly 7,000 proven AI-misconduct cases across 131 universities in 2023-24 — 5.1 per 1,000 students, up from 1.6 the prior year and rising to 7.5 per 1,000 in 2024-25. But those count only students who were caught; a University of Reading test found 94% of AI submissions went undetected.
What percentage of AI cheating goes undetected?
In the controlled University of Reading study, 94% of fully AI-generated exam answers were never flagged by markers, and the AI work scored higher than real students in 83% of comparisons. Turnitin’s scan of 200M+ assignments — only 3% reading as mostly AI — points to a similar large gap between use and detection.
Do AI detectors falsely accuse innocent students?
Yes. A Stanford study found detectors flagged 61.2% of essays by non-native English speakers as AI, versus 5.1% for native speakers. That is a major reason a number of institutions now treat detector scores as a prompt to investigate rather than as proof, and some have banned AI detectors entirely.
Are US universities catching more AI cheating than before?
Yes, sharply. The University of Maryland went from 135 to 215 AI cases in a year (+59%), West Virginia University from 11 to 242 over two years, and Columbia resolved 79 AI-related cases in 2025. These mirror the UK’s rising proven-case rate.
What should I do if I’m flagged but didn’t cheat?
Focus on authorship evidence rather than arguing with the score. Draft history, version logs, and notes carry more weight than the detector output itself — see our guide on whether version history is enough as proof and what to do in the first 24 hours.
Sources & References
- The Guardian (via UNESCO ETICO). “Revealed: thousands of UK university students caught cheating using AI.” etico.iiep.unesco.org. Accessed July 25, 2026.
- Anara. “AI in Higher Education Statistics: The Complete 2025 Report.” anara.com. Accessed July 25, 2026.
- Scarfe, P. et al., University of Reading. “A real-world test of artificial intelligence infiltration of a university examinations system.” PLOS ONE. Accessed July 25, 2026.
- The Cheat Sheet. “Scottish Universities Catch 1,000+ Students Cheating With AI, Up 700%.” thecheatsheet.substack.com. Accessed July 25, 2026.
- The Diamondback. “AI-related academic violation cases at UMD increased in 2024-25.” dbknews.com. Accessed July 25, 2026.
- The Daily Athenaeum. “Academic Dishonesty cases decrease amid 157% rise in AI-related reports.” thedaonline.com. Accessed July 25, 2026.
- Feedough. “86+ AI Cheating Statistics 2026: Academic Misconduct Rates & Trends.” feedough.com. Accessed July 25, 2026.
- Liang, W. et al., Stanford. “GPT detectors are biased against non-native English writers.” arxiv.org. Accessed July 25, 2026.
- Nature. “Universities are relying on AI-detection software to catch cheating. How well do the programs work?” nature.com. Accessed July 25, 2026.
